
Should you buy or rent is not a question with one right answer, it is a math problem with a timeline attached. And in 2026, that timeline got noticeably longer than the old rule of thumb most people still repeat.
What's Inside
- The short answer
- The price-to-rent ratio
- Why the breakeven timeline got longer
- The real cost of buying beyond the mortgage
- The real cost of renting, beyond "throwing money away"
- How long do you actually plan to stay?
- When buying clearly wins, when renting clearly wins
- Common mistakes
- Frequently asked questions

Should you buy or rent a home is really two separate questions stacked together: is your local market priced in a way that favors buying right now, and will you stay long enough for that math to actually pay off? Get either one wrong and the "obviously correct" choice can quietly cost you money for years.
This guide covers the price-to-rent ratio that answers the first question, the genuinely current shift in how long buying takes to break even, and the honest all-in costs of both paths.
Quick honesty note
This is one of the most time-sensitive articles on this site. Price-to-rent ratios, breakeven timelines, and cost-of-entry statistics move with rates and local markets, several figures below should be rechecked periodically, not treated as fixed.
The Short Answer
The Price-to-Rent Ratio

The formula
Price-to-rent ratio = Home price ÷ Annual rent for a comparable property.
Swipe to see more →
| Ratio | What it suggests |
|---|---|
| Below 15 | Favors buying |
| 15-20 | Neutral, personal factors decide |
| Above 20 | Favors renting |
This is a quick screening tool, not a final answer. Coastal, high-cost metros commonly sit well above 20, while many Midwest and Sun Belt markets sit closer to or below 15, which is exactly why national headlines about "the housing market" rarely apply cleanly to any one city.
Why the Breakeven Timeline Got Longer

For years, "5 to 7 years to break even on buying" was the standard rule of thumb. In 2026, that horizon has stretched to roughly 7 to 14 years in most metros, driven by a combination of still-elevated home prices, higher rates than the 2010s, and a national price-to-rent ratio sitting well above its long-run average.
The cost of entry has moved a lot
Since 2020, U.S. home prices have risen roughly 54%, pushing the price-to-income ratio to nearly five times the median income, compared to roughly three times in the 1990s. The cash needed to purchase a median-priced home has roughly doubled over the same period, and the resulting monthly payment on a comparable home has followed a similar trajectory.
None of this means buying is a bad decision now, it means the timeline for buying to actually pay off relative to renting has gotten longer almost everywhere, and shorter only in a smaller set of specific, more affordable markets.
The Real Cost of Buying Beyond the Mortgage
- Closing costs. Typically 2%-6% of the purchase price, paid upfront. See closing costs explained.
- Ongoing maintenance. Commonly budgeted at 1%-2% of home value annually.
- Property taxes and insurance. Vary significantly by location, often the most underestimated recurring cost.
- The opportunity cost of your down payment. Money tied up in home equity is money not invested elsewhere, a real cost even though it feels invisible month to month.
The Real Cost of Renting, Beyond "Throwing Money Away"
Rent buys housing services and optionality, nothing more, nothing less. The money you are not tying up in a down payment, closing costs, and ongoing maintenance can be invested elsewhere, and a fair rent-versus-buy comparison has to credit renting for that, not just penalize it for building no equity. The "renting is throwing money away" framing quietly ignores this side of the ledger.
How Long Do You Actually Plan to Stay?
This is the question that decides everything else. The median U.S. homeowner stays in a home for roughly 13 years, comfortably clearing even the longer breakeven horizons discussed above. The median first-time buyer, however, stays for only about 7 to 8 years, which is right at the edge of, or potentially short of, today's stretched breakeven range in many markets. If you are a first-time buyer without strong conviction that you will stay put for a decade, run your local numbers carefully before assuming buying automatically wins.
When Buying Clearly Wins, When Renting Clearly Wins
- Buying tends to win when your local price-to-rent ratio is under 15, you plan to stay 7+ years, and you have stable income and a genuine emergency reserve beyond your down payment.
- Renting tends to win when your ratio is above 20, your timeline is uncertain or under 5 years, or you would need to stretch your budget to the edge of affordability to buy right now.
- The 15-20 zone is where personal factors, career stability, family plans, how much you value flexibility, legitimately decide the outcome more than the math does.
Common Mistakes (and How to Dodge Them)
- Using national averages instead of local data. Price-to-rent ratios vary enormously by metro, and even by neighborhood.
- Relying on the old 5-7 year breakeven rule. The horizon has stretched meaningfully in most markets. Check current figures, not the conventional wisdom.
- Ignoring the opportunity cost of a down payment. A fair comparison credits renting for what that capital could earn invested elsewhere.
- Assuming you'll stay longer than you actually will. The median first-time buyer's actual tenure is shorter than many buyers plan for at the outset.
- Treating rent as pure waste. It buys flexibility and liquidity, which have real value, not just "nothing" compared to equity.
Frequently Asked Questions
What is the price-to-rent ratio and how do I use it?
The price-to-rent ratio is a home's price divided by the annual rent for a comparable property. A ratio under 15 generally favors buying, 15 to 20 is neutral territory where personal factors decide, and above 20 generally favors renting. It is a quick screening tool, not a substitute for a full breakeven analysis of your specific situation.
How long does it take for buying a home to break even versus renting?
Historically, the rule of thumb was 5 to 7 years. In 2026, that horizon has stretched to roughly 7 to 14 years in most metros, driven by elevated home prices relative to rents and higher mortgage rates than the 2010s. The exact breakeven point depends heavily on your local market and assumed appreciation rate.
Is renting really "throwing money away"?
Not accurately, no. Rent pays for housing services and flexibility, and the money not tied up in a down payment, closing costs, and ongoing maintenance can be invested elsewhere. A fair comparison between renting and buying credits renting for that opportunity, rather than treating all rent paid as pure loss.
How long do most people actually stay in a home after buying?
The median U.S. homeowner stays in a home for roughly 13 years, well beyond most breakeven horizons. The median first-time buyer, however, stays for only about 7 to 8 years, which is close to or potentially shorter than today's stretched breakeven range in many markets, worth factoring in honestly before assuming buying is the better choice.
What costs should I include when comparing buying to renting?
Beyond the mortgage payment, include closing costs, ongoing maintenance (commonly 1% to 2% of home value annually), property taxes, insurance, and the opportunity cost of the down payment. On the renting side, credit the comparison with what that same down payment could earn if invested instead.
Does the buy-or-rent answer change by city?
Significantly, yes. Coastal and high-tax metros often have price-to-rent ratios well above 20, favoring renting, while many Midwest and Sun Belt markets sit closer to or below 15, favoring buying. National averages rarely reflect what is actually true in any specific city or neighborhood.
Run Your Own Numbers, Not the National Average
Should you buy or rent a home comes down to your local price-to-rent ratio and an honest estimate of how long you will actually stay, not a feeling about which option sounds more responsible. Check your specific market's ratio, be realistic about your timeline, and remember that today's breakeven horizon is longer than the rule of thumb most people still repeat.
Take This Further
Books by Nwaeze David to help you build real wealth through property.
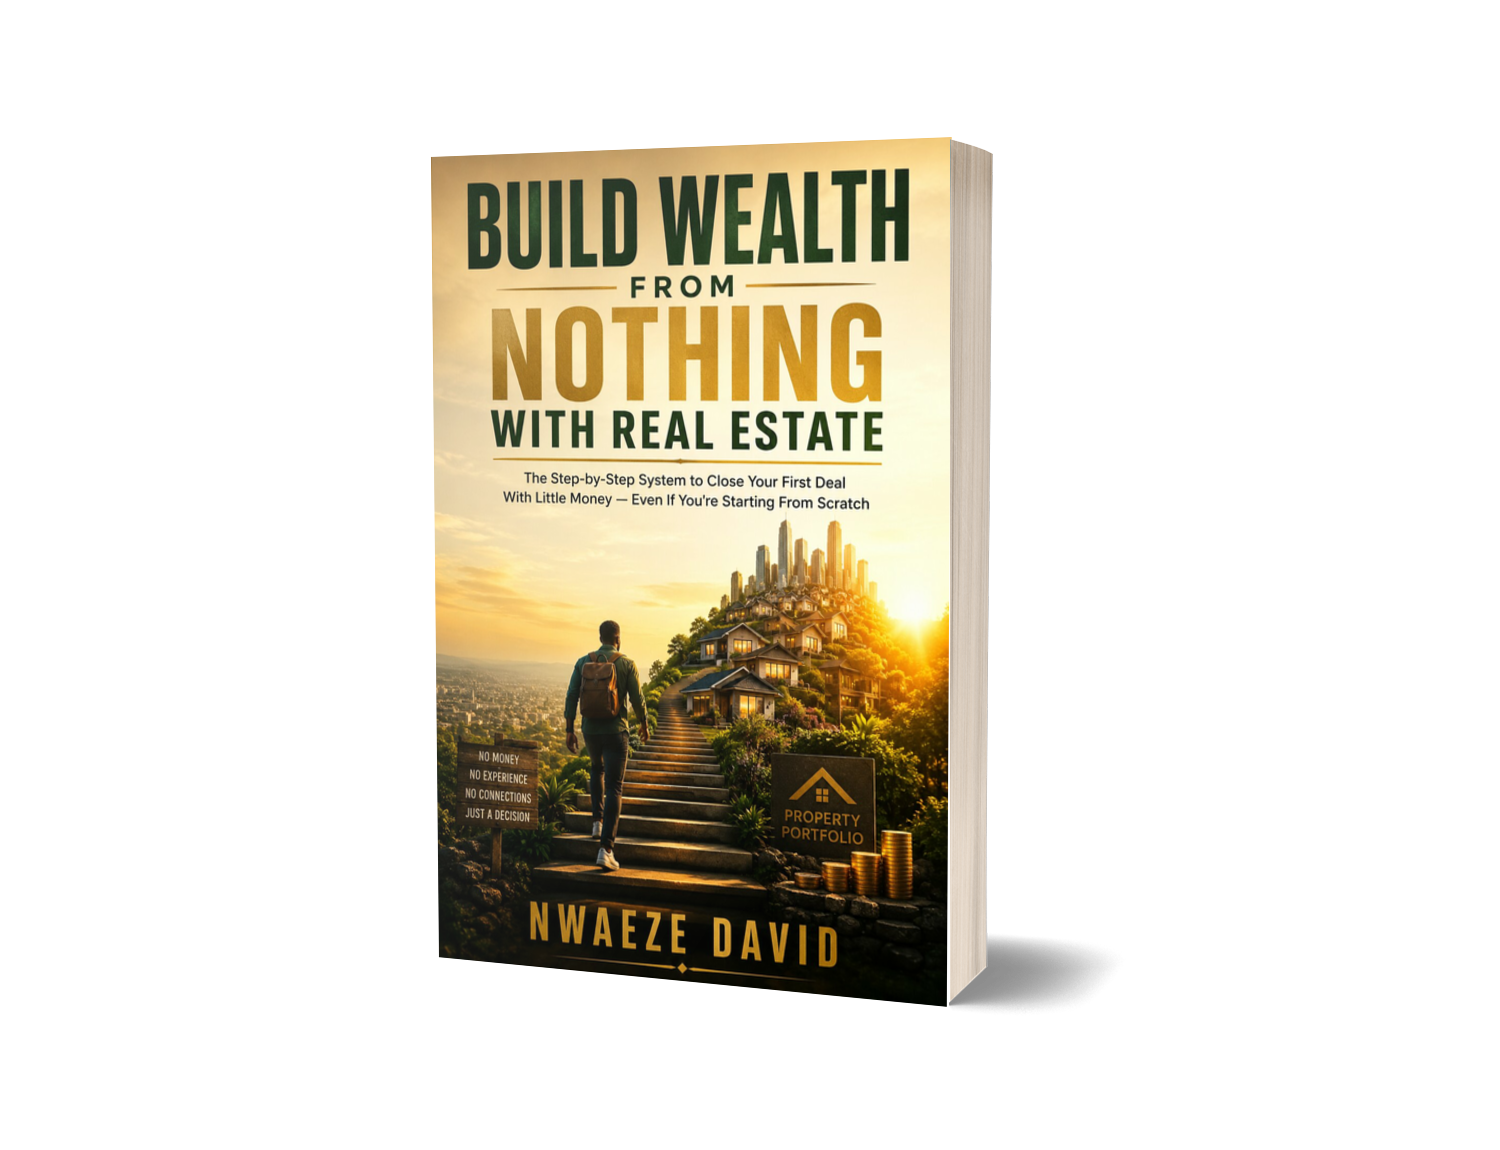
"You don't need a big deposit, perfect credit, or family money to build wealth in real estate. You need a system, the resourcefulness to work it, and the courage to start."
Get Your Copy →
"The AI Real Estate Investor gives you that system. It shows you exactly how to point AI at the parts of your business that actually make money."
Get Your Copy →
"The Diaspora Property Blueprint is the complete, step-by-step system for buying land and building wealth back home safely, from anywhere in the world."
Get Your Copy →Get help running your own numbers
Join the newsletter for practical, no-hype breakdowns of the real estate decisions that actually move your net worth, then step inside the private community where we help you run the buy-vs-rent math for your specific market.
Keep learning: first-time home buyer guide · how much house can i afford? · closing costs explained · real estate vs stocks · buying and selling a home.
Education only, not financial advice. Price-to-rent ratios, breakeven timelines, and cost-of-entry statistics change with market conditions and vary significantly by location; figures here are illustrative and marked for verification where noted. Run the numbers for your specific local market and personal timeline, or speak to a financial advisor, before deciding.

Written by
Nwaeze David
Nigerian digital entrepreneur, educator and author of three real estate books. He writes practical, honest guides for new investors, working realtors and Africans building back home from abroad.


